Notebooks have sped up time to chart. Count speeds up time to decision.
Notebooks like Jupyter and Hex give analysts powerful tools to explore data. They’re great for writing queries, running models, and producing outputs.
But when analysis needs to be shared, discussed, and turned into a decision, notebooks break down and Count begins — a canvas built for agentic analytics, where the AI does the analysis, not just the query.
Notebooks: “Give analysts the tools to do their technical work”
Count: “Turn that work into trusted decisions, by bringing the business in”
Notebooks give you SQL, Python, and visualisations in a linear sequence of cells.
Count gives you all of that on an infinite canvas so you can branch into hypotheses, fork assumptions, lay out your thinking visually, and backtrack without losing context.
Analytics isn't linear. Your workspace shouldn't be either.
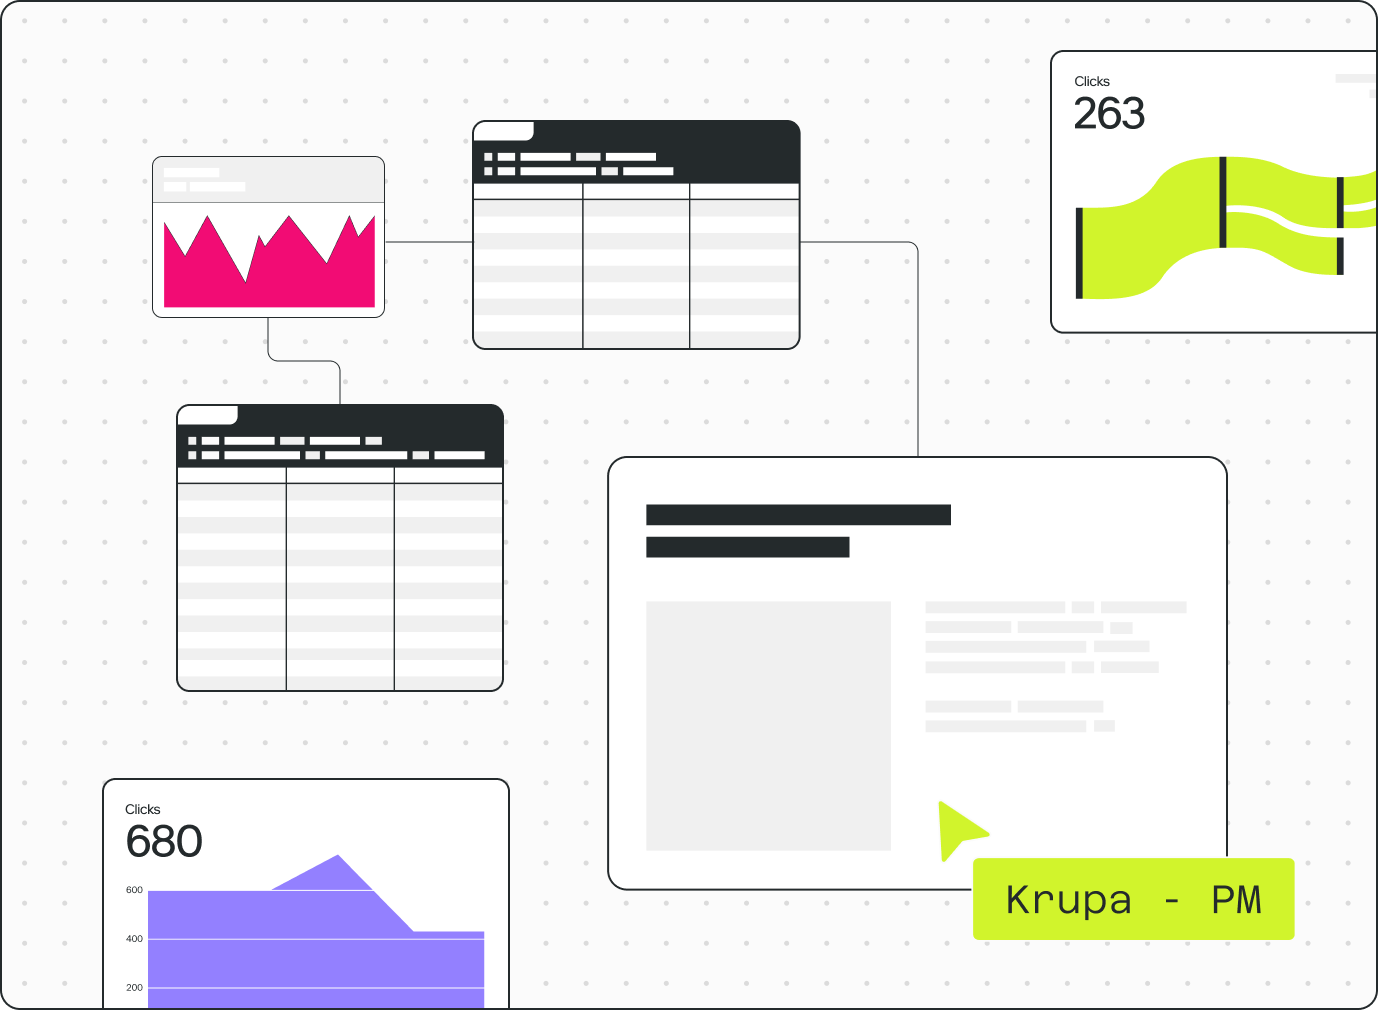
Notebooks work well for data practitioners, but break down when others need to get involved.
Sharing is hard. Context is lost. Collaboration happens outside the tool.
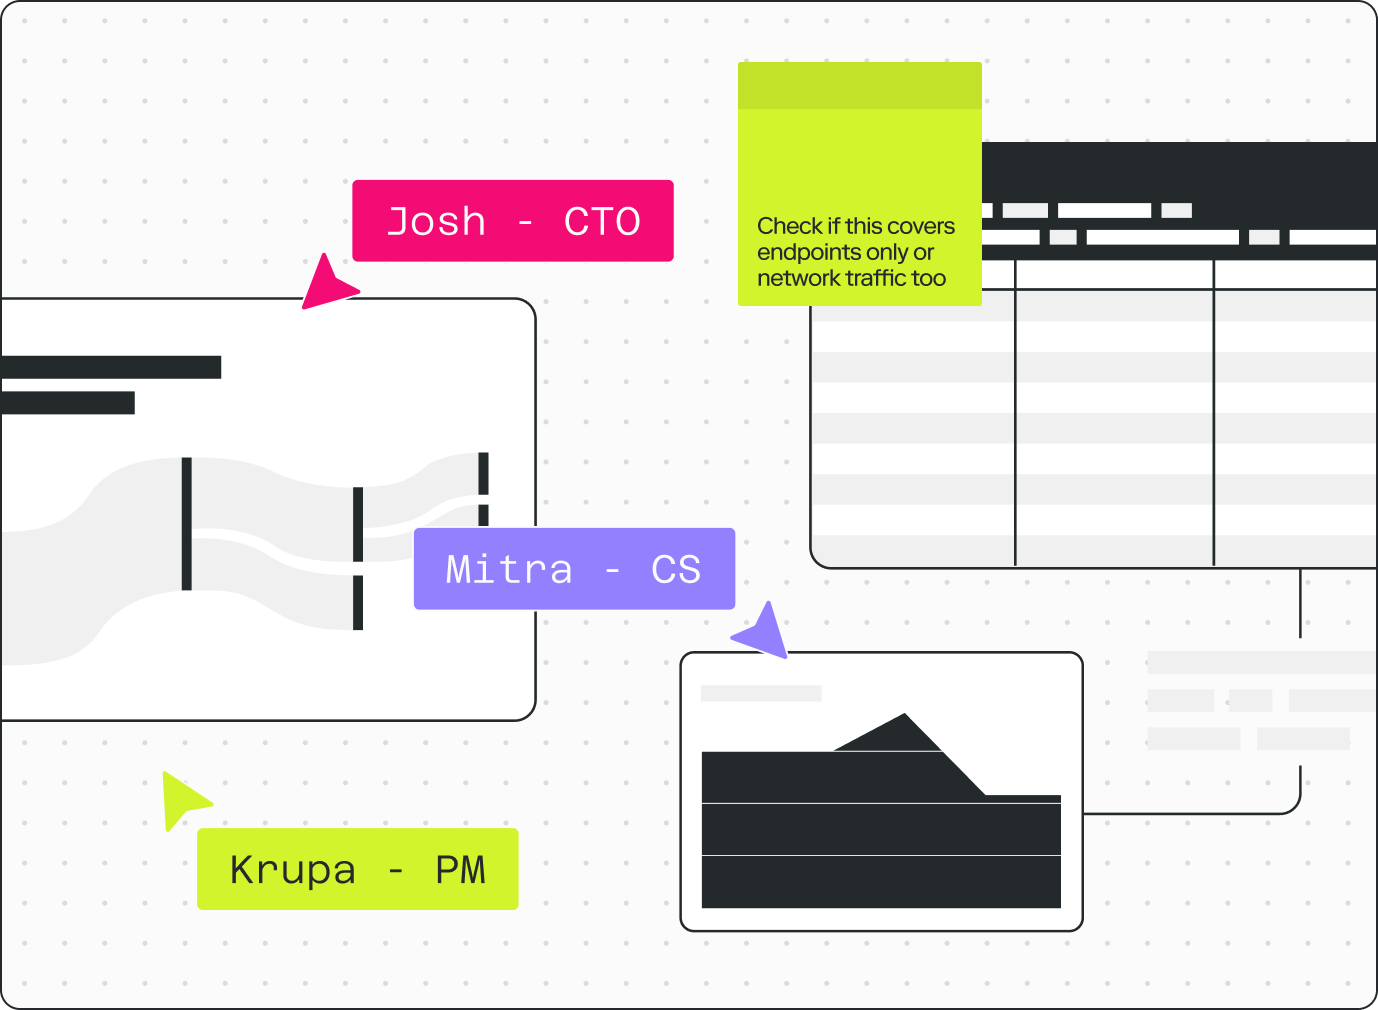
Count lets data teams work iteratively with business stakeholders in the same space.
Stakeholders follow the logic, challenge the numbers, and contribute context the analyst doesn't have. Projects move faster and the outcome is trusted by default.
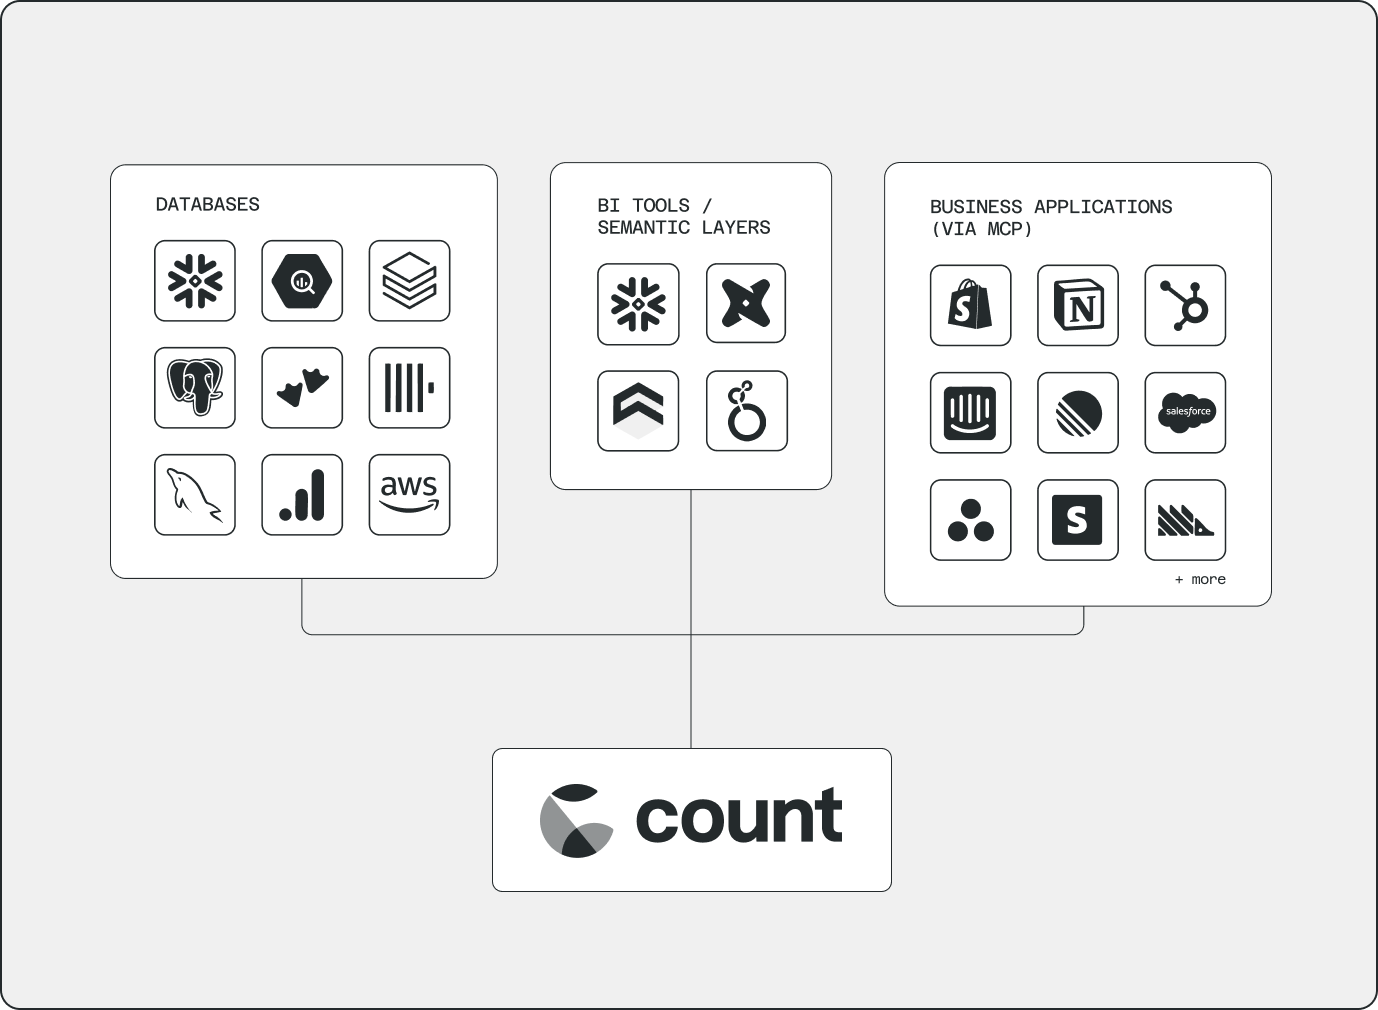
Notebooks typically connect to your data warehouse and that's it.
But the most valuable answers come from combining data from different places in novel ways - your CRM, billing system, product analytics, spreadsheets.
Count connects your warehouse, semantic layer, CSVs, and business tools via MCP servers directly in the canvas.
No new pipelines. The question drives the analysis, not what's already been modelled.
Compare Count vs Data Notebooks
Count doesn't replace the power of notebooks - it brings it into a more collaborative, flexible environment.
| Capability | Notebooks | Count |
|---|---|---|
| Analysis | ||
| SQL querying | Yes | Yes |
| Python / scripting | Limited | Yes |
| Complex modelling & transformations | Yes | Yes |
| AI exploration | Yes | Yes |
| Low-code / drag-and-drop exploration | — | Yes |
| Large-scale data science projects | Yes | — |
| Workflow | ||
| Work with messy / raw data in-workflow | Yes | Yes |
| Non-linear, canvas-based exploration | Yes | Yes |
| Native dbt & GitHub integration | Limited | Yes |
| Connect business apps (CRM, billing, etc.) | — | Yes |
| Collaboration | ||
| Real-time multiplayer editing | Limited | Yes |
| Comment & discuss on the analysis | Limited | Yes |
| Non-technical users can follow work | — | Yes |
| Outputs & presentation | ||
| Dashboards | Yes | Yes |
| Self-service via Slack bot / MCP | Limited | Yes |
| Metric trees & process flows | — | Yes |
| Slide decks & presentations | — | Yes |
| Long form reports | Yes | Yes |
solving
in the age
of AI.
Problem solving in the age of AI.
A field guide for data analysts who want to deliver reliable business impact with data.
- →The 5 capabilities that define the best analytical problem solvers
- →10 problem-solving frameworks with worked examples
- →How to leverage AI to support, not replace, your workflow
FAQs
Yes. SQL and Python run in the same workspace, so you can query the warehouse and then model, reshape or chart the result without exporting it anywhere.
You can also work with raw and messy sources in-flow — CSVs, APIs and MCP servers — rather than loading everything into the warehouse first.
Yes, both are native integrations. Analysis builds on the dbt models your team already maintains rather than re-deriving them, and your work stays version controlled.
No, and that is deliberate. If you are training models, running long compute jobs or managing a package-heavy pipeline, a notebook like Jupyter is the better tool and Count is not trying to replace it.
Count is built for the analysis that needs an audience: exploring a question, showing the working, and getting a team to a decision.
Yes, and this is the main gap Count fills. A notebook is linear and written for the person who wrote it. A canvas lays the work out spatially, so a stakeholder can see which question led to which result, comment in place, and branch off without reading code.
Analysts and stakeholders edit the same document in real time, instead of the analysis being exported into slides once it is finished.