BI tools show you numbers. Count helps you make decisions
BI tools like Tableau, Looker, and Omni are built to share data at scale. They’re great for distributing core metrics and supporting day-to-day operations.
Count is designed to help teams understand their business better, use data to solve problems and get everyone aligned so decisions can be made faster. It’s built for agentic analytics: the AI does the analysis, not just the query.
BI tools: “What happened?”
Count: “What’s going on &
what should we do next?”
BI tools are built for single-player workflows. Analysts build dashboards. The business consumes them.
The valuable work - the questions, debates, and decisions - happens elsewhere.
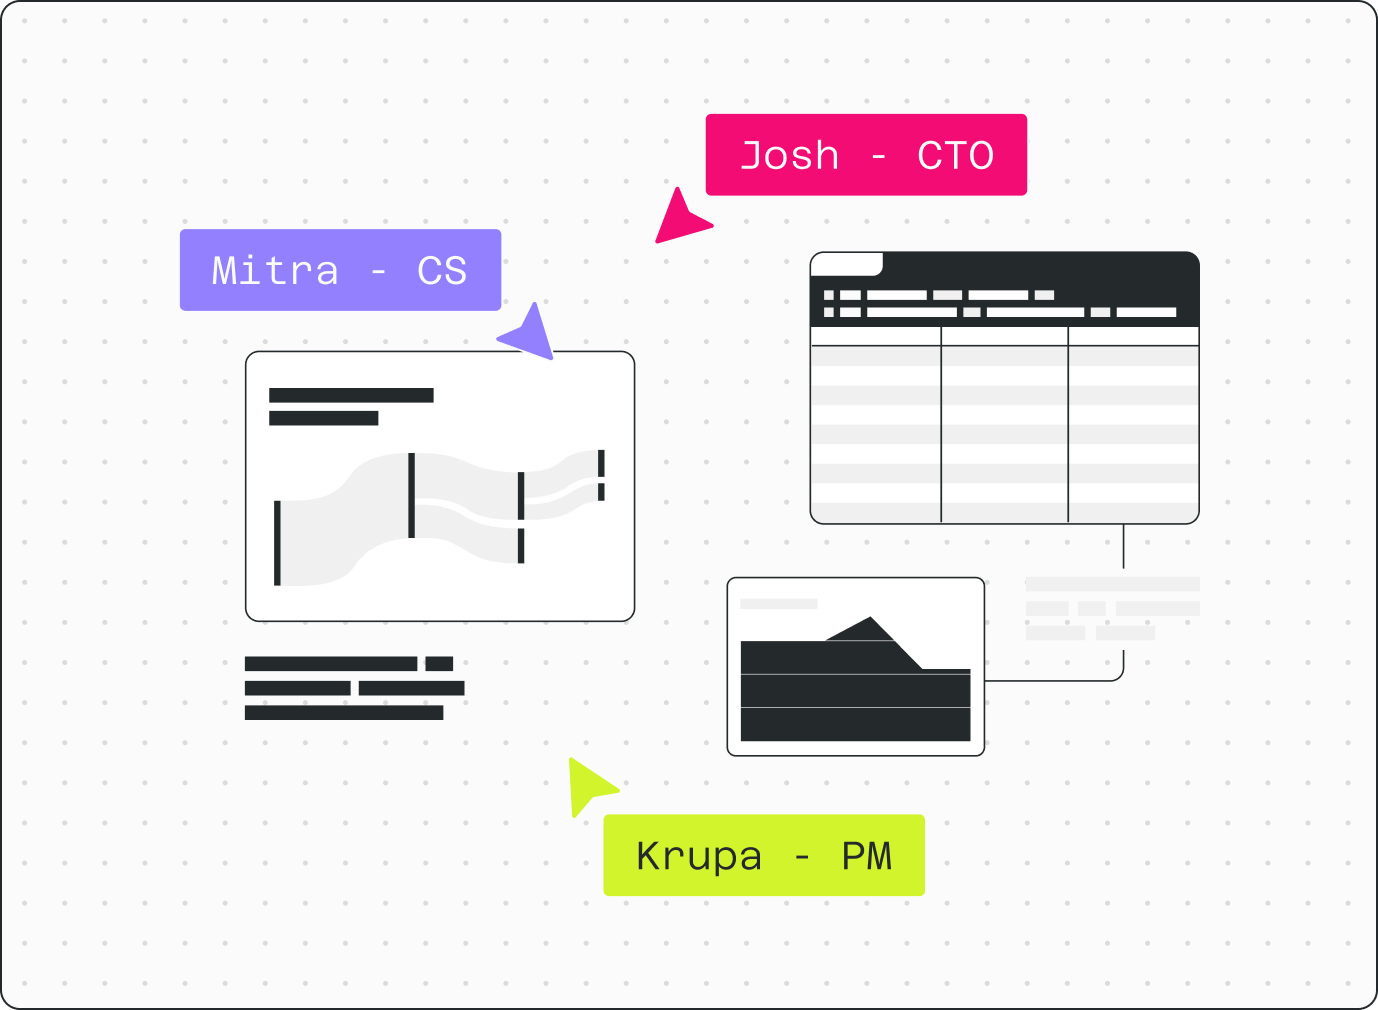
Count gives that work a home. Data teams and business users explore together, build shared understanding, and iterate quickly to find answers.
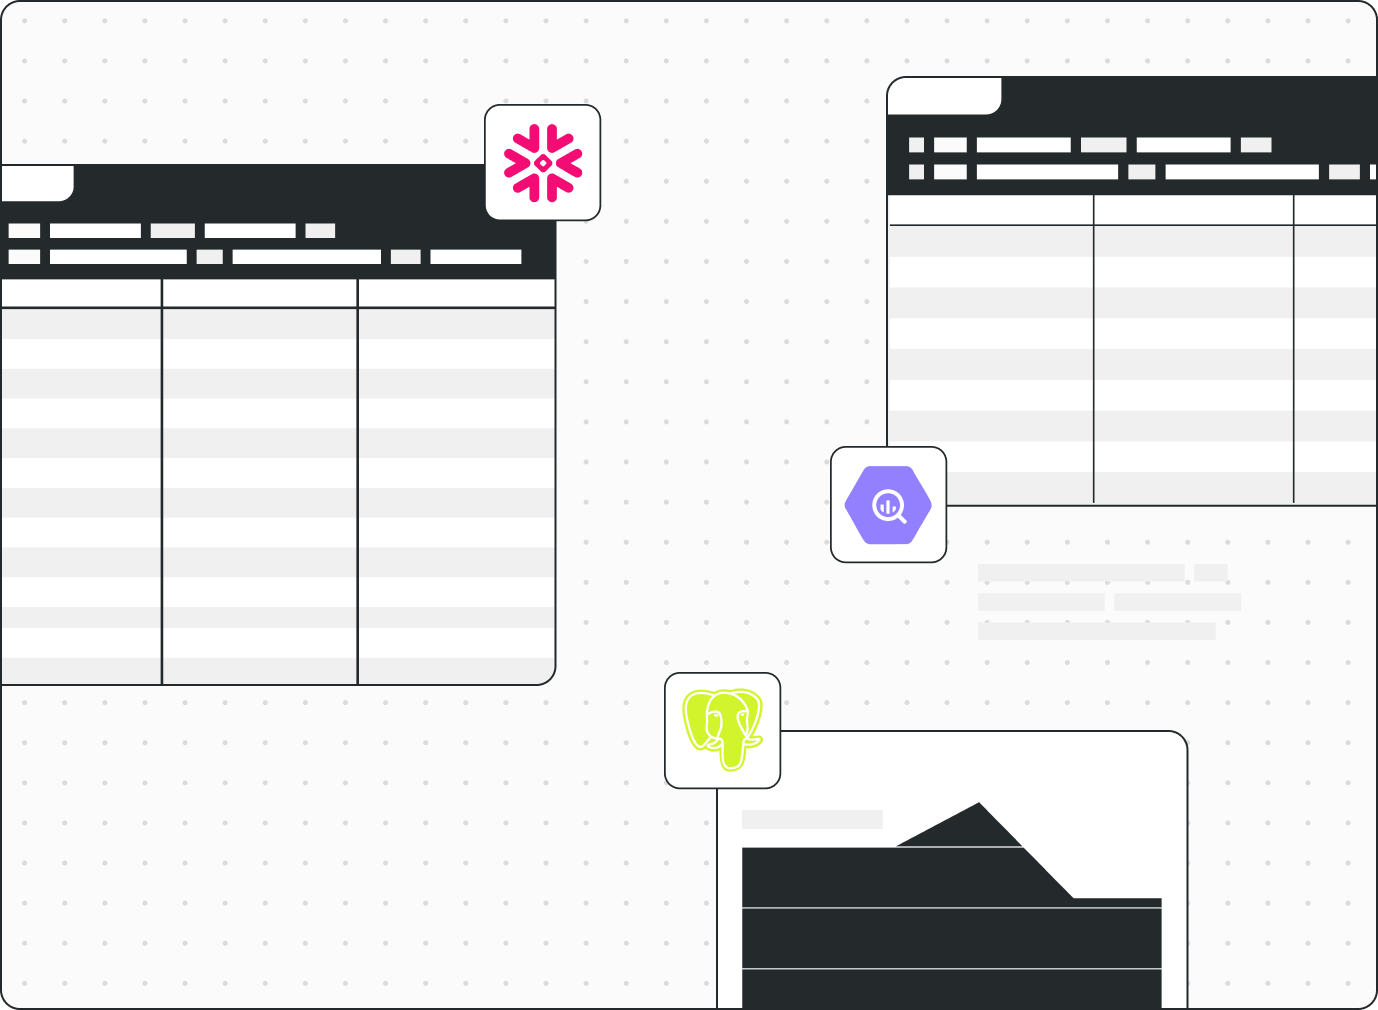
BI tools depend on clean, pre-modelled data. Exploration is limited, because numbers can't easily be questioned or rebuilt.
Count gives you all the tools to work with any sort of data. SQL, Python, and low-code, allowing you to clean, model, and analyse data in one workflow.
Every step is visible and auditable, so answers can be trusted.
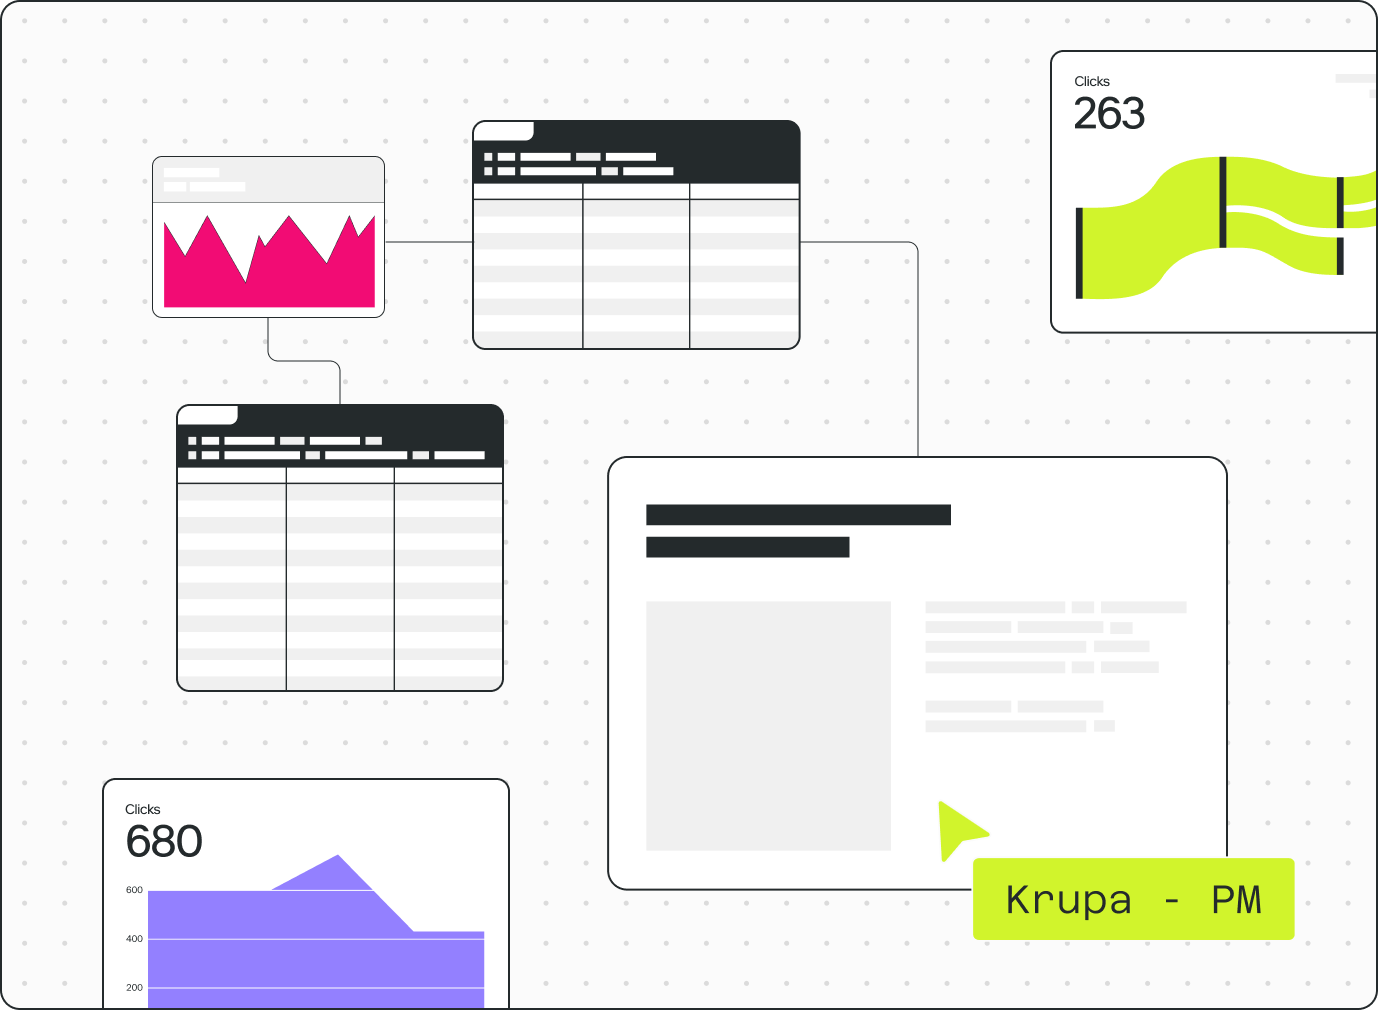
BI tools primarily produce dashboards - every insight has to fit the same format, making it difficult to tell a story or adapt the output to different audiences.
Count lets you present the same analysis as slide decks, metric trees, narrative reports, or dashboards.
The output fits the use case, and you never have to rebuild in another tool.
Compare Count vs BI tools
Count covers all the core BI use cases plus the stuff which actually helps your business improve.
| Capability | BI Tools | Count |
|---|---|---|
| Reporting & distribution | ||
| Operational dashboards | Yes | Yes |
| Scheduled reports & alerts | Yes | Yes |
| Fine-grained permissions | Yes | Yes |
| Semantic model / metric definitions | Yes | Yes |
| Distribute reports at scale across org | Yes | Yes |
| Row-level permissions | Yes | Coming soon |
| Embedded analytics | Yes | — |
| Exploration & analysis | ||
| AI analyst (query generation, pattern detection) | Limited | Yes |
| Advanced visualisations | Limited | Yes |
| SQL & Python in the same workspace | — | Yes |
| Non-linear, canvas-based exploration | — | Yes |
| Branch, drill, and backtrack without rebuilding | — | Yes |
| Connect raw data sources (CSVs, MCP, APIs) | — | Yes |
| Clean and transform data in-workflow | — | Yes |
| Collaboration | ||
| Version control | Yes | Yes |
| Comment & discuss on the analysis | Limited | Yes |
| Visible reasoning & audit trail | — | Yes |
| Analyst & stakeholder work in same space | — | Yes |
| Outputs & presentation | ||
| Dashboards | Yes | Yes |
| Self-service via Slack bot / MCP | Yes | Yes |
| Metric trees & process flows | — | Yes |
| Slide decks & presentations | — | Yes |
| Long form reports | — | Yes |
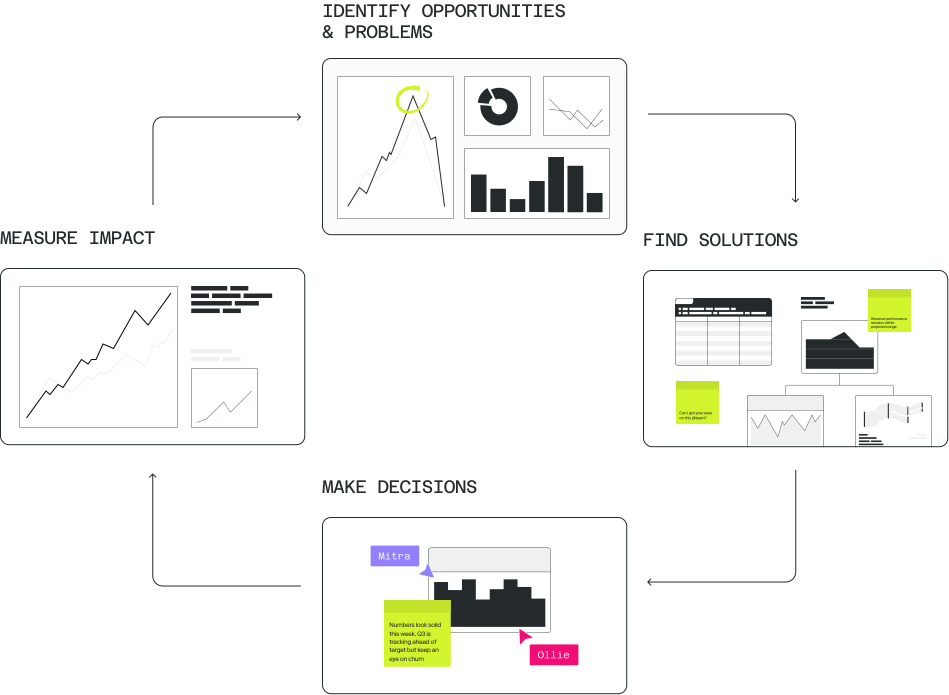
Create a flywheel of better decisions
Count gives you the tools to not just observe your business but walk through the full analytical life-cycle to a conclusion.
BI tools + Count
Already have a BI tool? No problem. Most of our customers use Count alongside their BI tool, at least initially.
Count supports all major semantic layers and MCP servers alongside data warehouses so you can use the same data in both tools.
Explore integrations →For data & leadership teams
decision-
making
gap.
The decision-making gap.
Why most companies move slower than they should and a diagnostic to find out where you stand.
- →The four-stage maturity curve for decision velocity
- →The four structural barriers nearly every company faces
- →An 8-question diagnostic to map where your org sits
FAQs
Yes. Count supports all major semantic layers and MCP servers alongside your data warehouse, so the metric definitions your team already maintains carry over instead of being rebuilt.
That is why most teams run Count next to their BI tool at first. Both read the same governed definitions, so the numbers agree.
Not today. If you need to embed dashboards inside your own product for your customers, a traditional BI tool is still the right choice for that part of your stack.
Count is built for the analysis and decision-making that happens inside your team, and runs alongside a BI tool that handles embedded use cases.
Row-level permissions are coming. Fine-grained permissions are available today, so you can control who can see and edit each workspace, project and canvas.
Count also supports the semantic layers that many teams already use to enforce row-level rules upstream.
Both work in the same space. Analysts write SQL and Python on the canvas; stakeholders read the analysis, comment on it in place, and branch off their own questions without anyone rebuilding the work.
That is the structural difference from BI, where analysts work in one tool and everyone else consumes a finished dashboard.